

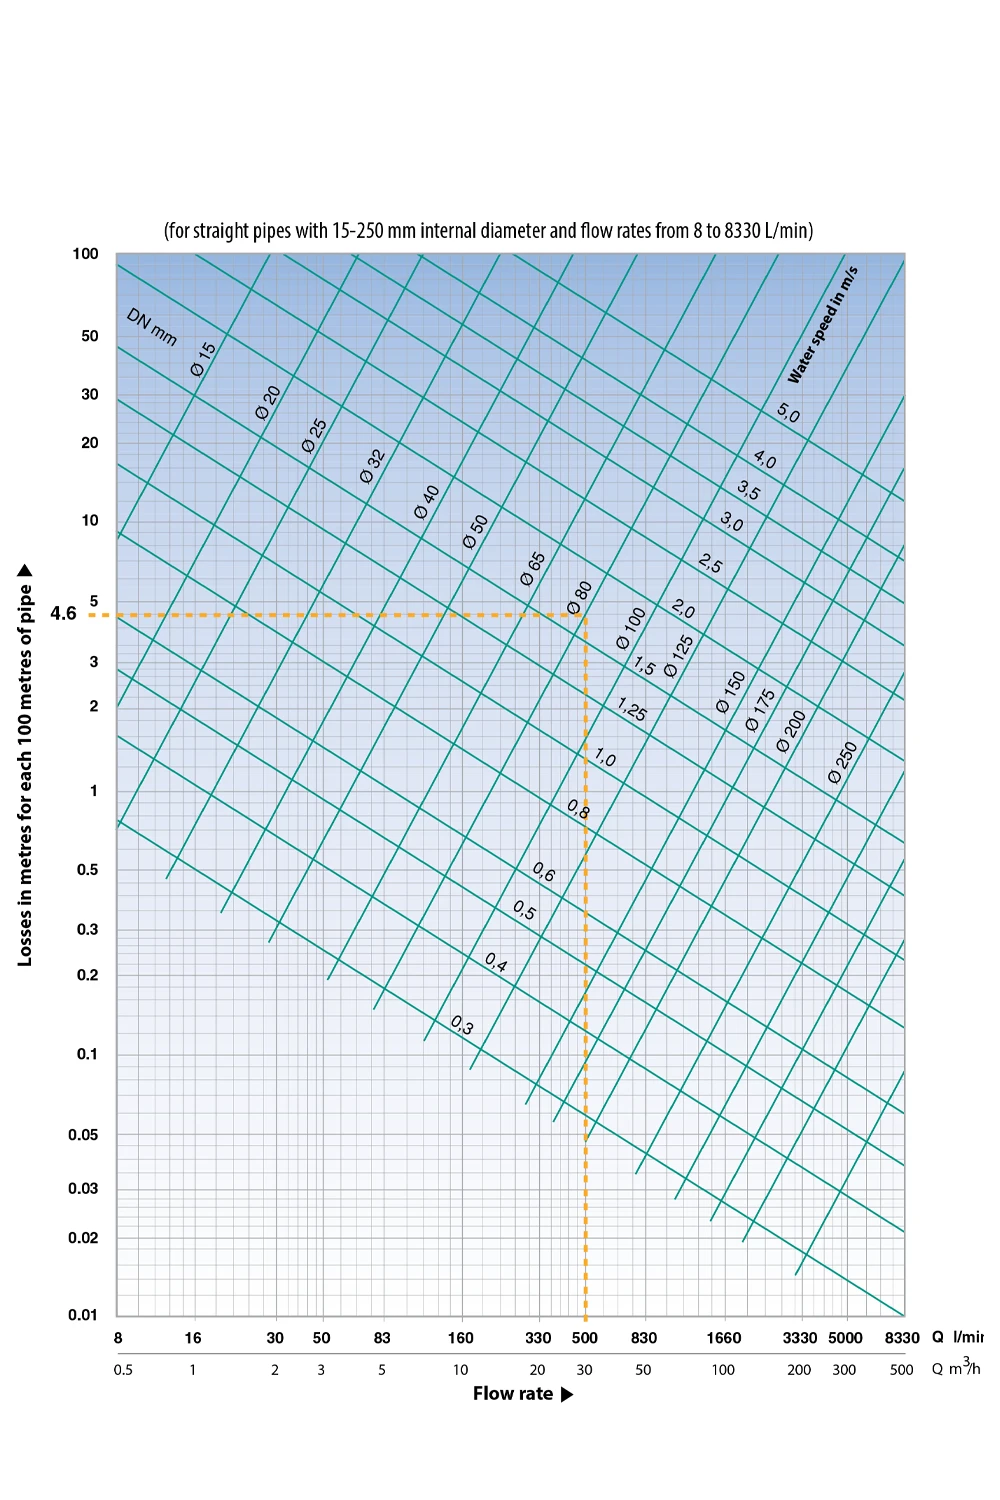
Friction Loss Chart
The Friction Loss Chart helps estimate pressure loss in straight pipework. It is useful when selecting pumps, checking pipe sizes or planning a water system.
As water moves through a pipe, friction reduces pressure. Therefore, the pump may need to work harder to deliver the required flow at the outlet. This chart shows estimated losses for cold water and liquids with a similar kinematic viscosity. It is based on new cast iron pipes with internal diameters from 15 mm to 250 mm and flow rates from 8 to 8330 l/min.
However, pipe condition can affect the final result. For new steel pipes, multiply the load loss value by 0.8. For old, slightly rusty iron pipes, multiply it by 1.25. In addition, for older pipes with internal build-up, multiply the value by 1.7. To use the chart, first find the required flow rate along the horizontal axis. Then, follow the chart to the correct pipe diameter line. After that, read the corresponding pressure loss from the vertical axis.
For example, if the chart shows a loss of 4.6 m per 100 m of pipe, the actual loss depends on pipe material and pipe length. For a new steel pipe, the value becomes 3.68 m per 100 m. As a result, a 50 m pipe run would have a loss of 1.84 m. This information can help when comparing pipe sizes and pump duties. For example, a smaller pipe may increase friction loss, while a larger pipe can reduce pressure drop.
In addition, the chart can support early system planning before a detailed calculation is completed. It is especially useful for checking whether a pump has enough available head for the full installation. For more accurate selection, other factors should also be considered. These include fittings, valves, bends, pipe material, water temperature, vertical lift and required outlet pressure.